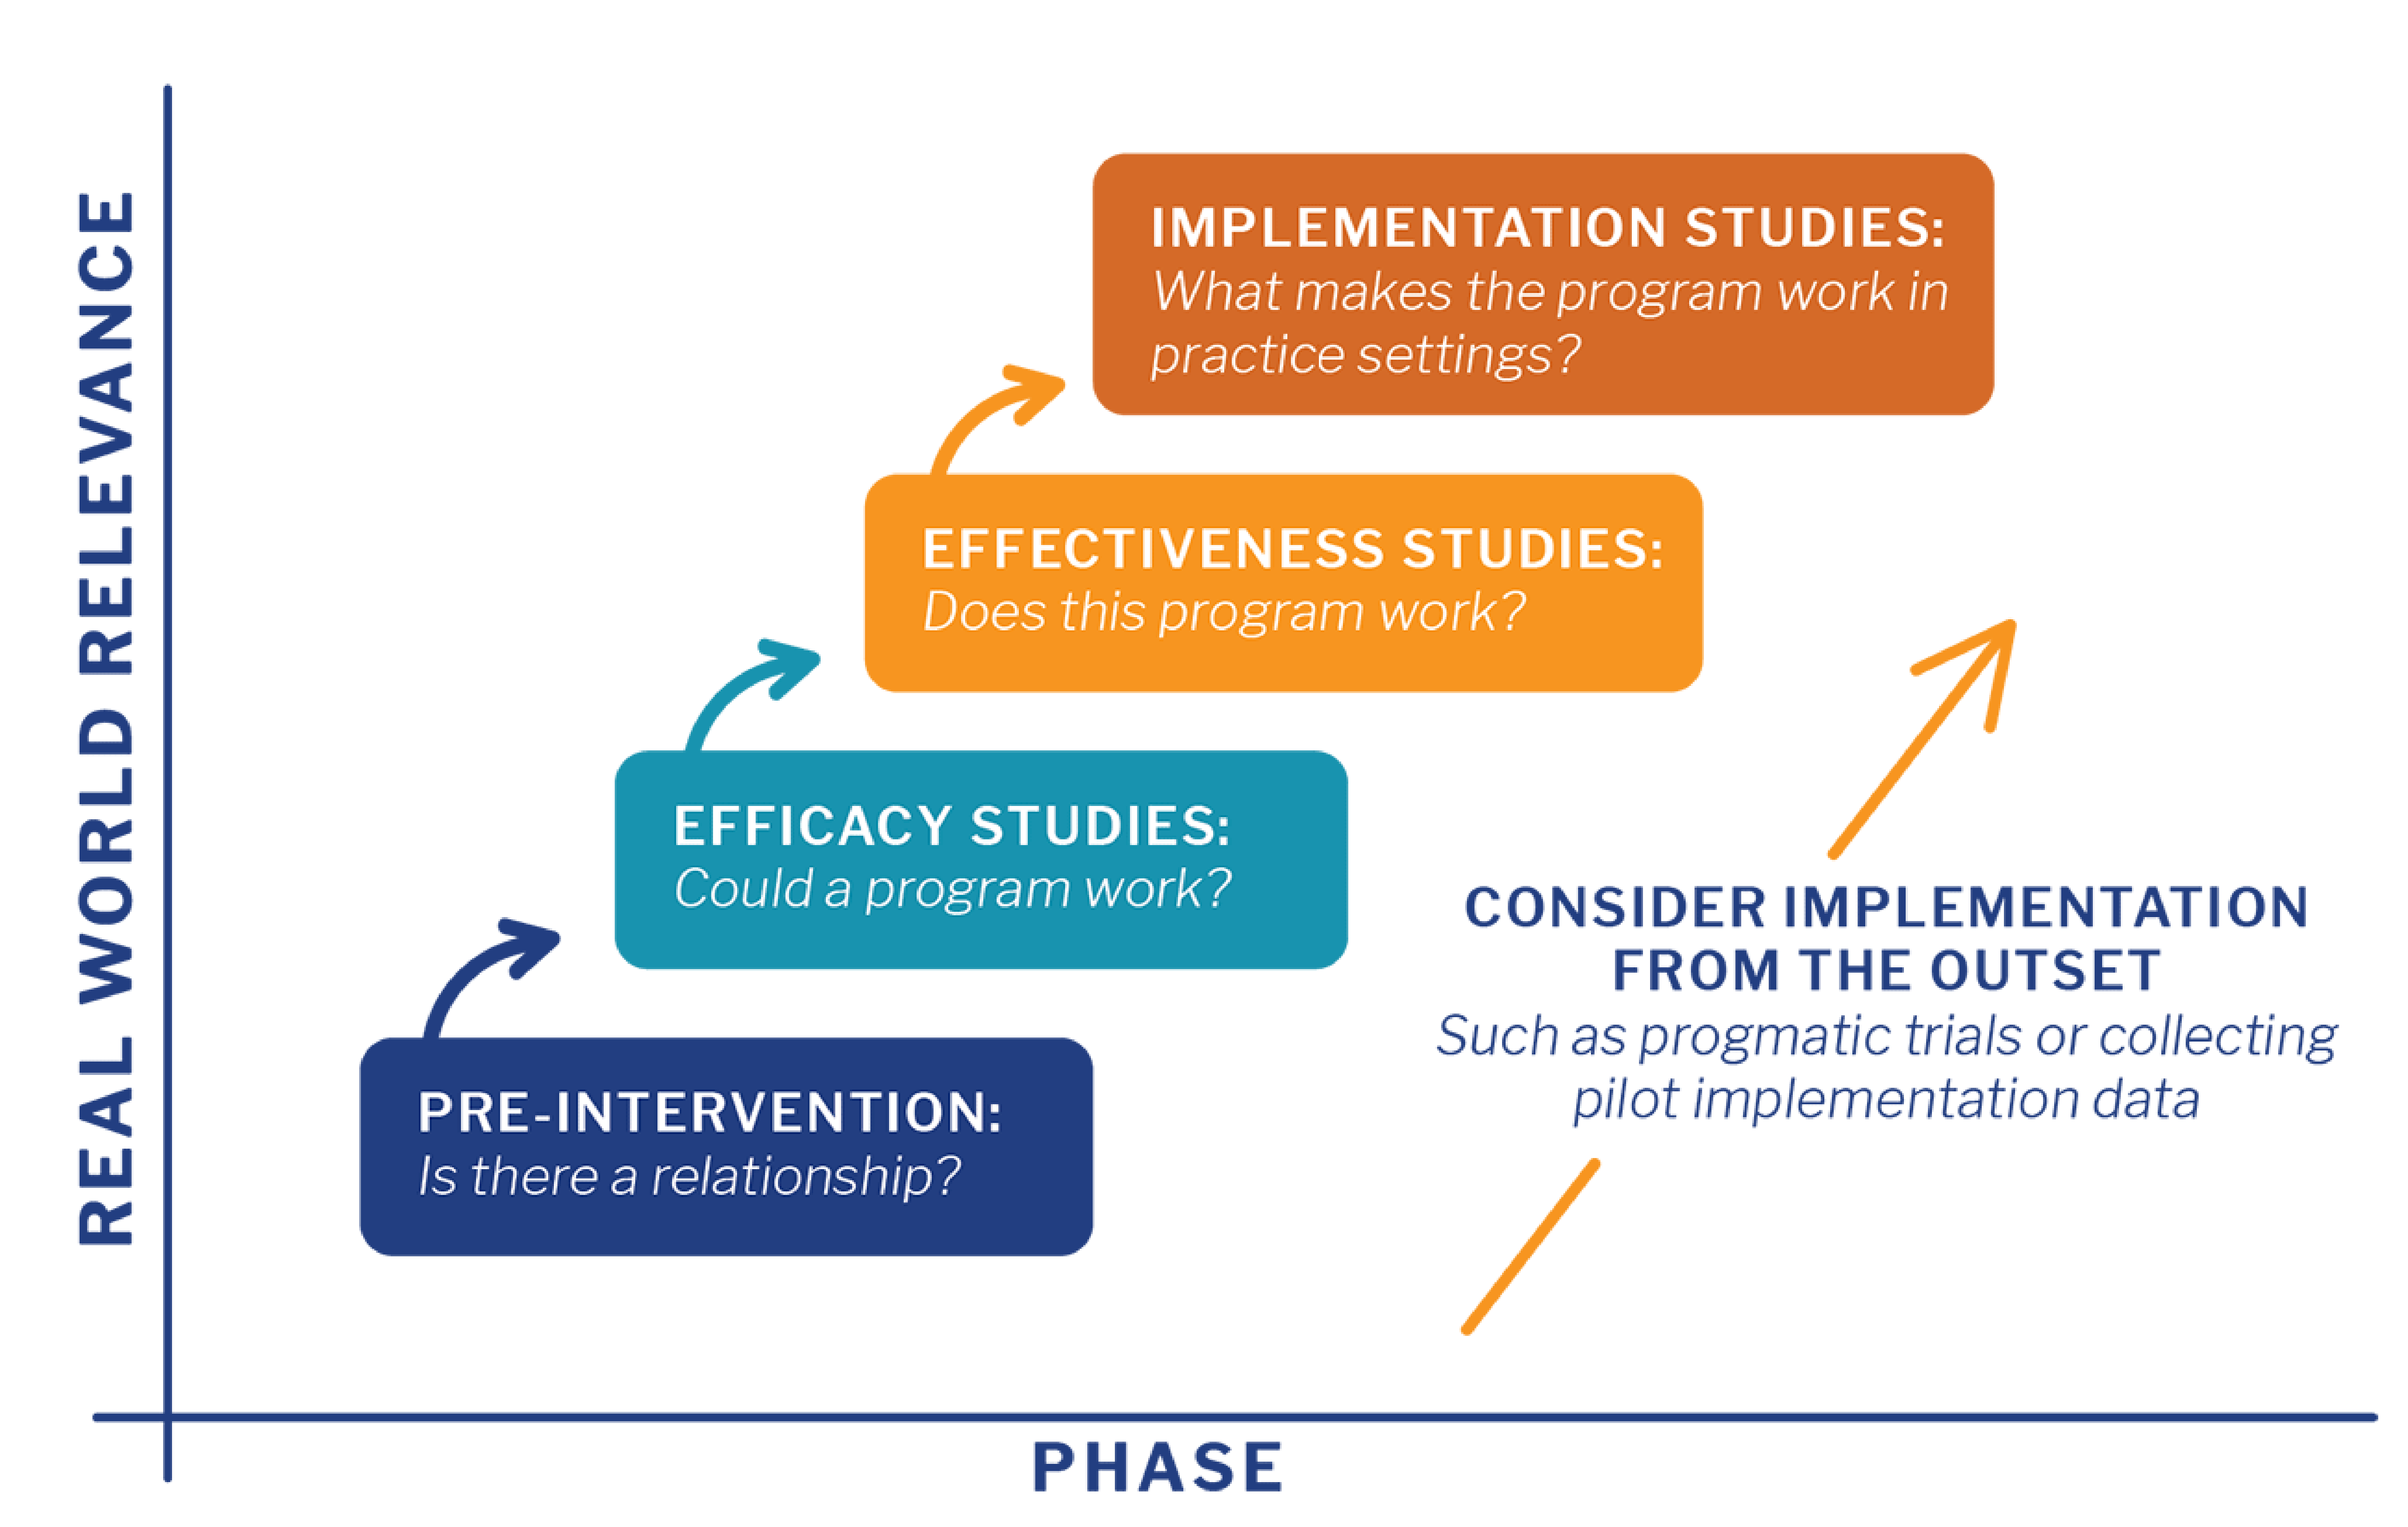
Graph showing the translational research continuum and the level of real-world relevance for each phase. The first phase is pre-intervention, meaning is there a relationship? This has the lowest real-world relevance. The next phase is efficacy studies, meaning could a program work? This has slightly higher real-world relevance than pre-intervention. The third phase is effectiveness studies, meaning does the program work? This has higher relevance than both pre-intervention and efficacy studies. The fourth and final phase is implementation studies, meaning what makes the program work in practice settings? This has the highest level of real-world relevance. Additionally, to the right side of the graph there is an arrow starting at the bottom of the graph and ending at the top saying to consider implementation from the outset, such as collecting pilot implementation data. Figure adapted from Landsverk et al, Chapter 12, figure 12-1. Stages of research and phases of dissemination and implementation research, in Brownson, Colditz and Proctor 2012, Dissemination and Implementation in Health: Translation Science to Practice, Oxford: Oxford University Press.